Challenge Description
(Source)
Vastopolis is a major metropolitan area with a population of approximately two million residents. During the last few days, health professionals at local hospitals have noticed a dramatic increase in reported illnesses. Observed symptoms are largely flu-like and include fever, chills,sweats, aches and pains, fatigue, coughing, breathing difficulty, nausea and vomiting, diarrhea, and enlarged lymph nodes. More recently, there have been several deaths believed to be associated with the current outbreak. City officials fear a possible epidemic and are mobilizing emergency management resources to mitigate the impact. You have been charged with providing an assessment of the situation.
We provide you with two datasets. The first one contains microblog messages collected from various devices with GPS capabilities. These devices include laptop computers, handheld computers, and cellular phones. The second one contains map information for the entire metropolitan area. The map dataset contains a satellite image with labeled highways, hospitals, important landmarks, and water bodies. We also provide supplemental tables for population statistics and observed weather data. Additional information is provided in the README file.
MC 1.1 Origin and Epidemic Spread: Identify approximately where the outbreak started on the map (ground zero location). If possible, outline the affected area. Explain how you arrived at your conclusion. (Short answer)
MC 1.2 Epidemic Spread: Present a hypothesis on how the infection is being transmitted. For example, is the method of transmission person-to-person, airborne, waterborne, or something else? Identify the trends that support your hypothesis. Is the outbreak contained? Is it necessary for emergency management personnel to deploy treatment resources outside the affected area? Explain your reasoning. (Detailed answer)
Solution
The solution to the problem is available and downloadable at this link.
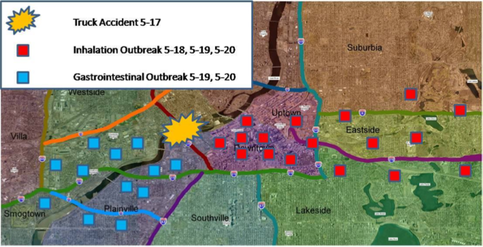
From 5/16 to 5/19, the wind is blowing from West to East. Microblog posts with symptoms that are largely flu-like in nature originate near the I-610 Bridge on 5/18 and disperse over a large cone shaped area in the direction of the wind. The density varies in high population areas. Transmission type is airborne.
The water current of the VAST river flows South (Southwest) at 3 mph. Microblog posts with symptoms that are largely gastrointestinal in nature originate near the I-610 Bridge on 5/19 and disperse along the river in the direction of the water current. The VAST River is part of a distributed water system and is used for obtaining drinking water. Transmission type is waterborne.
